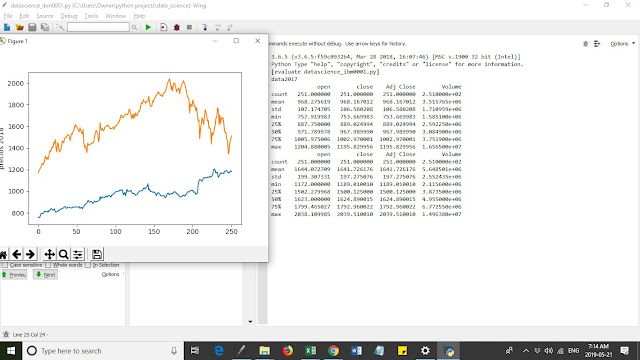
The code below is a summary of a year analysis in stock.
You could extract the data from yahoo finance.
(Go to https://help.yahoo.com/kb/SLN2311.html for more info).
Then you put the data in the same folder of your code.
Download the data from two years (e.g 2018, 2019) and erase the headlines (e.g header, open, close)
to allow easy process of the data.
#datascience_0001
import pandas as pd     #import libraries
import matplotlib as plt

path = "amazon2017.csv"    #define the location of your document in the computer
df = pd.read_csv(path, header=None)

headers= ['date','open','High','low','close','Adj Close','Volume']
# code above erase headers to avoid problems, then add them as you decide


df.columns = headers


data2017 = df[['date','open','close','Adj Close','Volume']].describe()
# This code above gives you a summary of the column
print('data2017')
print(data2017)       #print the summary of data defined in data2017

primero = df[['open']]

import matplotlib.pyplot as plt
plt.plot(primero)
plt.ylabel('prices 2017')
plt.show()


#code below is from other year
path = "amazon2018.csv" # The code is the same as above,
#but changes only the path to document
df = pd.read_csv(path, header=None)
headers= ['date','open','High','low','close','Adj Close','Volume']


df.columns = headers


data2018 = df[['date','open','close','Adj Close','Volume']].describe()
#code above replace'date' or 'open' by 'low' or any other parameter in headers
print(data2018)

a = df[['open']]

import matplotlib.pyplot as plt
plt.plot(a)
plt.ylabel('prices 2018')
plt.show()
#The output of code is shown below.'open' and 'close' prices were chosen, also 'volume'.
#You could choose any column you want by modifying data 2018
Possible errors
>builtins.FileNotFoundError: File b'amazon2017.csv' does not exist
solution:
Download the data and open it. Save in the desktop or the same folder
that you are working in with your python program.

No comments:
Post a Comment