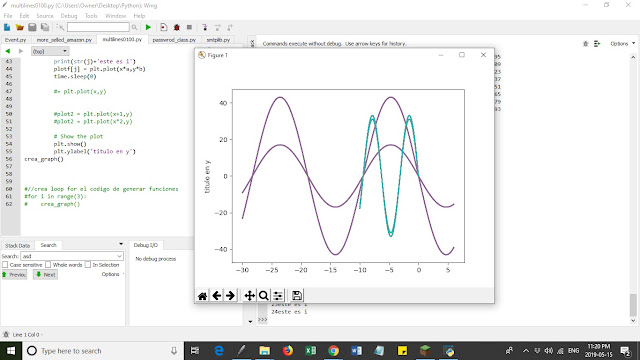
To generate random graphs we need first to thinks about the range of the random functions.
(If you are new to the random module read this paragraph, otherwise follow to the next one) -- >
New to random read here. You just go to python interpreter and press
>>> import random.
if it is not installed you go to command prompt in Windows ad type python -m pip install
then proceed to install the remaining packages.
#install necessary packages
import matplotlib.pyplot as plt
from matplotlib import pyplot
import numpy as np
import random
import time
$this line determine how many lines you need
NUMERODELINEAS = 4
def crea_graph():
# Create the vectors X and Y
plotf = []
for i in range(NUMERODELINEAS):
plotf.append('plot%d,' %i)
print('this is i0' + str(i))
for i in range(10):
time.sleep(0)
print('this is i1 ' + str(i))
a = random.randint(-50,50)
b = random.randint(-55, 55)
print('this is a ' + str(a) + ' and b ' + str(b))
x = np.arange((a+1), 10 , 0.01)
print('este es super ' + str(x))
y = b+np.sin(x)
#for i in range(4):
# print("plot{}".format(i))
# for i in range(4):
# print('plot%d,' %i)
# genera random para hacer la curva de sin o onda mas amplia (c = random.randrange)
c = random.randrange(-5,7)
print('this is c random' + str(c))
for j in range(NUMERODELINEAS):
print(str(j)+'este es i')
plotf[j] = plt.plot(a+x*c,c*y)
print('this is j' + str(j))
time.sleep(0)
#= plt.plot(x,y)
#plot2 = plt.plot(x+1,y)
#plot2 = plt.plot(x*2,y)
# Show the plot
plt.show()
plt.ylabel('titulo en y')
crea_graph()
d = random.randint(0, 7)
#//crea loop for el codigo de generar funciones
for i in range(d):
crea_graph()

No comments:
Post a Comment